Spatial Epigenetics
Exploring Epigenetic Signatures with Spatial Resolution
Assays that profile epigenetic modifications are important to understand gene regulation and function. Spatial resolution of these epigenetic signatures provide distributions of these biochemical modifications in their native tissue context and are becoming important tools to elucidate how the geometry of epigenetic changes affect the biology of disease or development [1].
AtlasXomics pioneered DBiT-seq (deterministic barcoding in tissue for spatial omics sequencing), a powerful technique to add spatial context to a variety of NGS assays. Through the utilization of microfluidic chips, DBiT-seq directs barcodes to tissue sections with precise coordinates. In particular, DBiT-seq can be used in conjunction with ATAC-seq, to provide a spatially resolved chromatin accessibility map[2].
When scaling up their analysis for customers, challenges arose — synthesizing tissue anatomy with epigenetic state relies on techniques in image processing and sequencing bioinformatics that involve computation-intensive analyses.
How AtlasXomics leverages Latch to analyze & deliver spatial ATAC-seq and CUT&Tag data for customers

Scientists run AtlasXomics’ Novel DBiT-seq Assay to Obtain Spatial Context for NGS Data.
AtlasXomics provides the DBiT-seq assay, which is the first platform to enable users to profile the epigenome with spatial context at the cellular level, building upon insight generated by single-cell ATAC-seq [2] and CUT&Tag [6]. Spatial epigenomics can uncover the causative relationships between the chromatin state or histone modifications and the context-specific gene expression of cells within tissue.
This assay combines high-quality imaging with advanced spatial barcoding techniques to locate their ATAC-seq data in tissue.
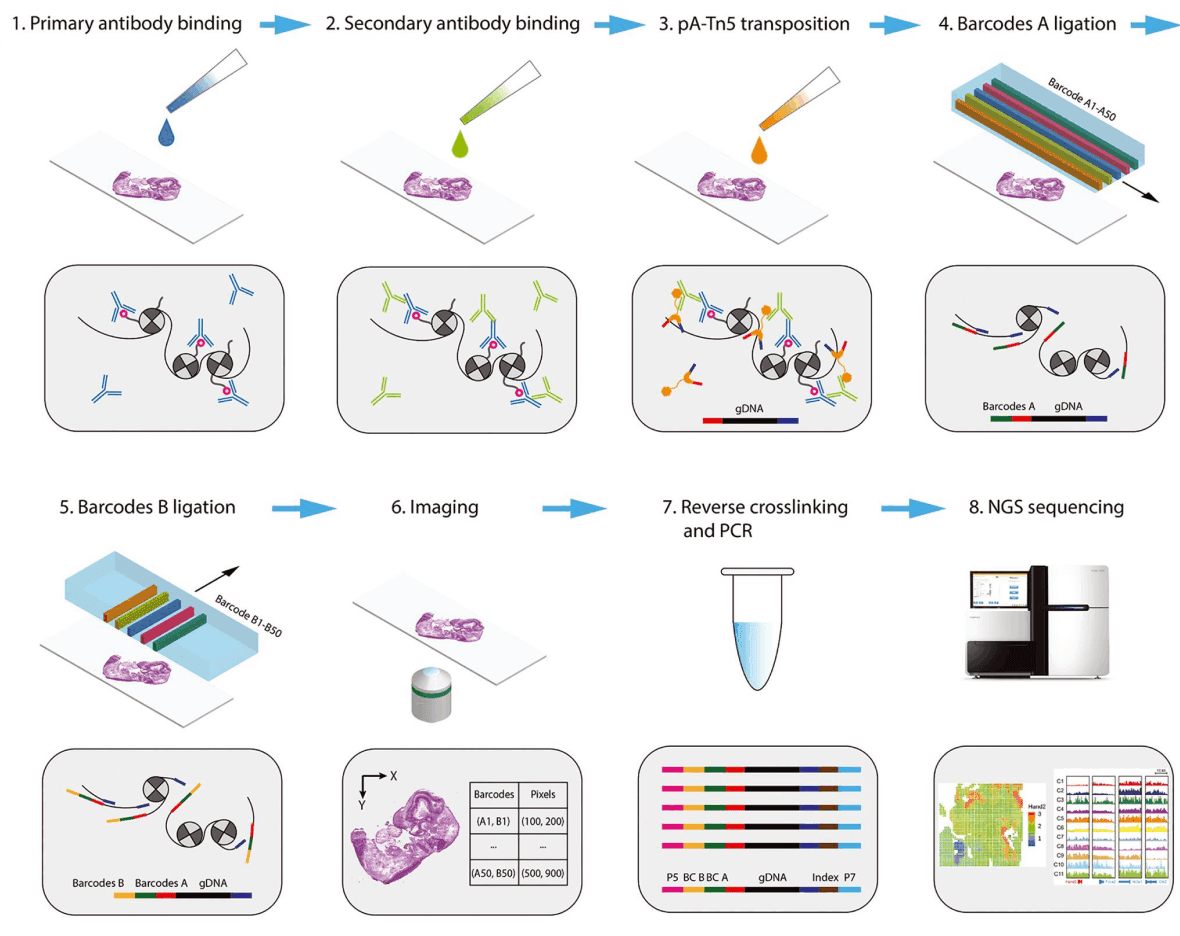
AtlasXomics provides services or kits for customers to process tissue samples with the DBiT-seq assay. The processing of these produces hundreds of gigabytes of FASTQ files stored on the Illumina BaseSpace platform, as well as high-resolution images.
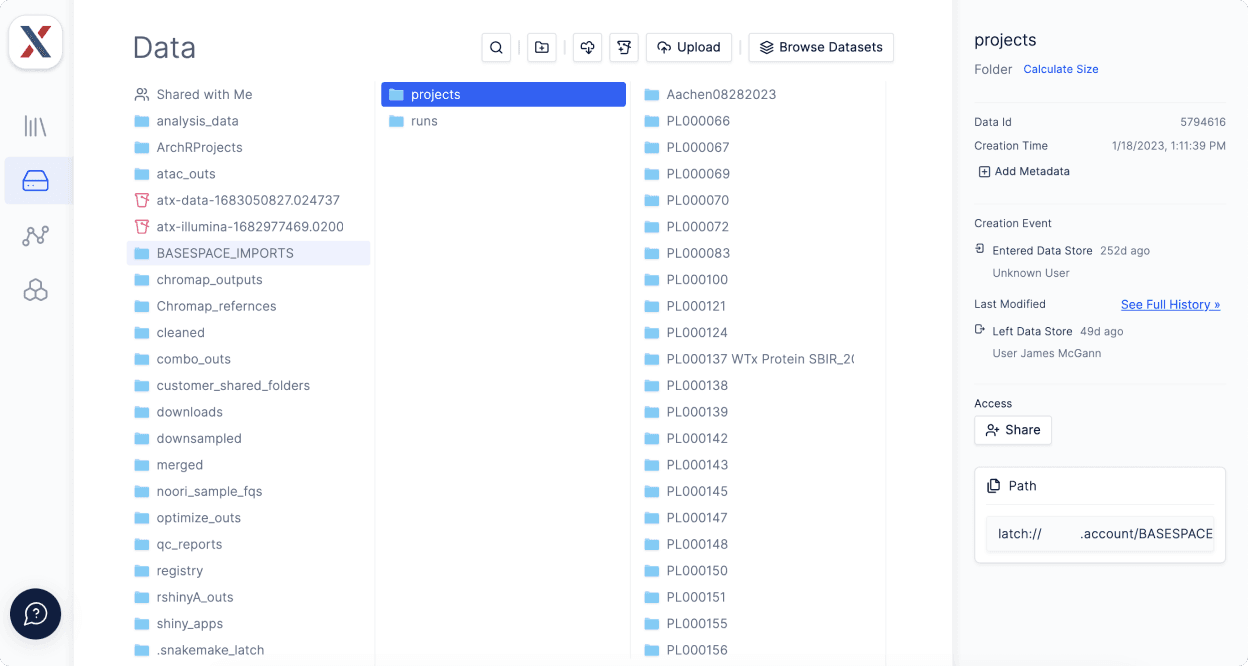
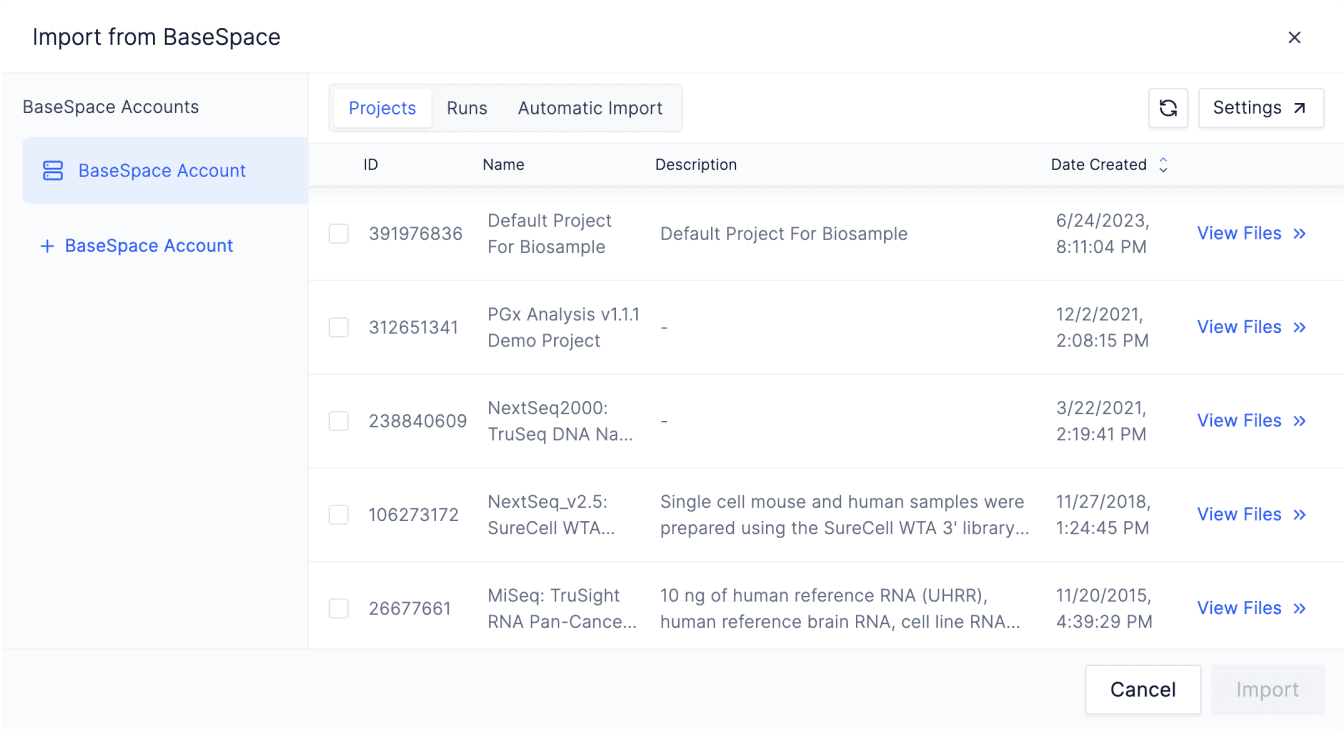
Using Latch’s native BaseSpace integration, these sequencing datasets can be easily imported into the AtlasXomics workspace and stored alongside all of the imaging and supplementary files.
AtlasXomics hosts their AtlasXBrowser through Latch to enable customers to perform image preprocessing
After the initial assay data has been collected, their customers must perform some basic preprocessing on the high-resolution images taken on the spatial samples. AtlasXomics created the AtlasXBrowser to allow customers to assign epigenetic sequencing data to the correct location in its original tissue.
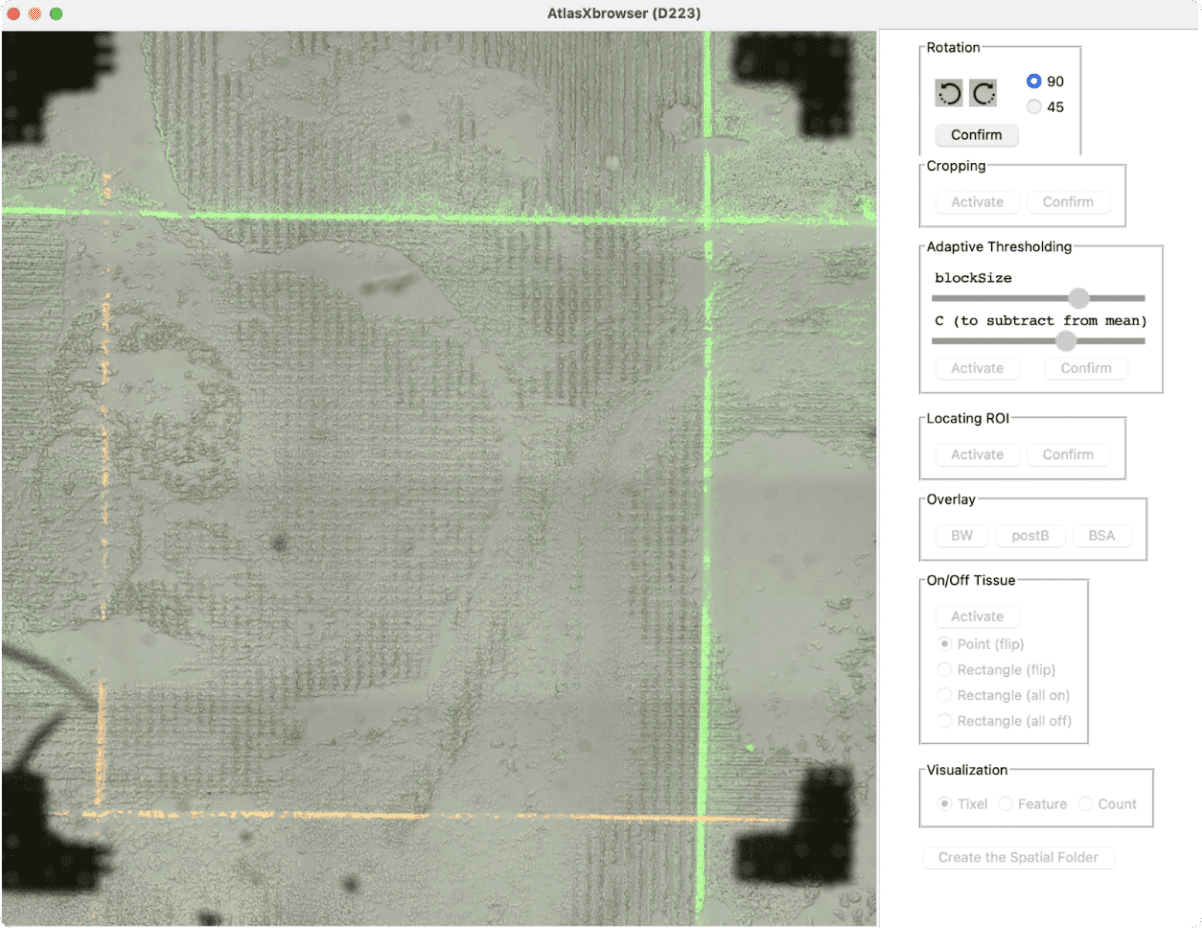
This web application guides scientists through basic image processing, allowing them to crop and designate the Region of Interest (ROI) and threshold to distinguish between on-tissue and off-tissue regions, and generate the spatially resolved barcodes needed to assign sequencing reads to image coordinates in downstream steps.
AtlasXomics’ bioinformaticians host this application using a Latch Pod, a flexible cloud-hosted computing environment. The Latch Pod is then published and hosted on a public link which can be accessed by AtlasXomics’ customers.
Scientists run a preprocessing NGS workflow to generate fragment files from raw sequencing data.
The spatial epigenomics assays generate large files of barcoded sequencing reads, each of which corresponds to a unique transposase insertion event at the sequenced locus [4]. These reads must be aligned to a reference genome, their barcodes error corrected, their adapters trimmed and aligned coordinates adjusted for known behaviors of the transposase (Tn5-shift) [5]. The result is a fragment file, annotating sequenced fragments with genomic coordinates and error-corrected barcodes.
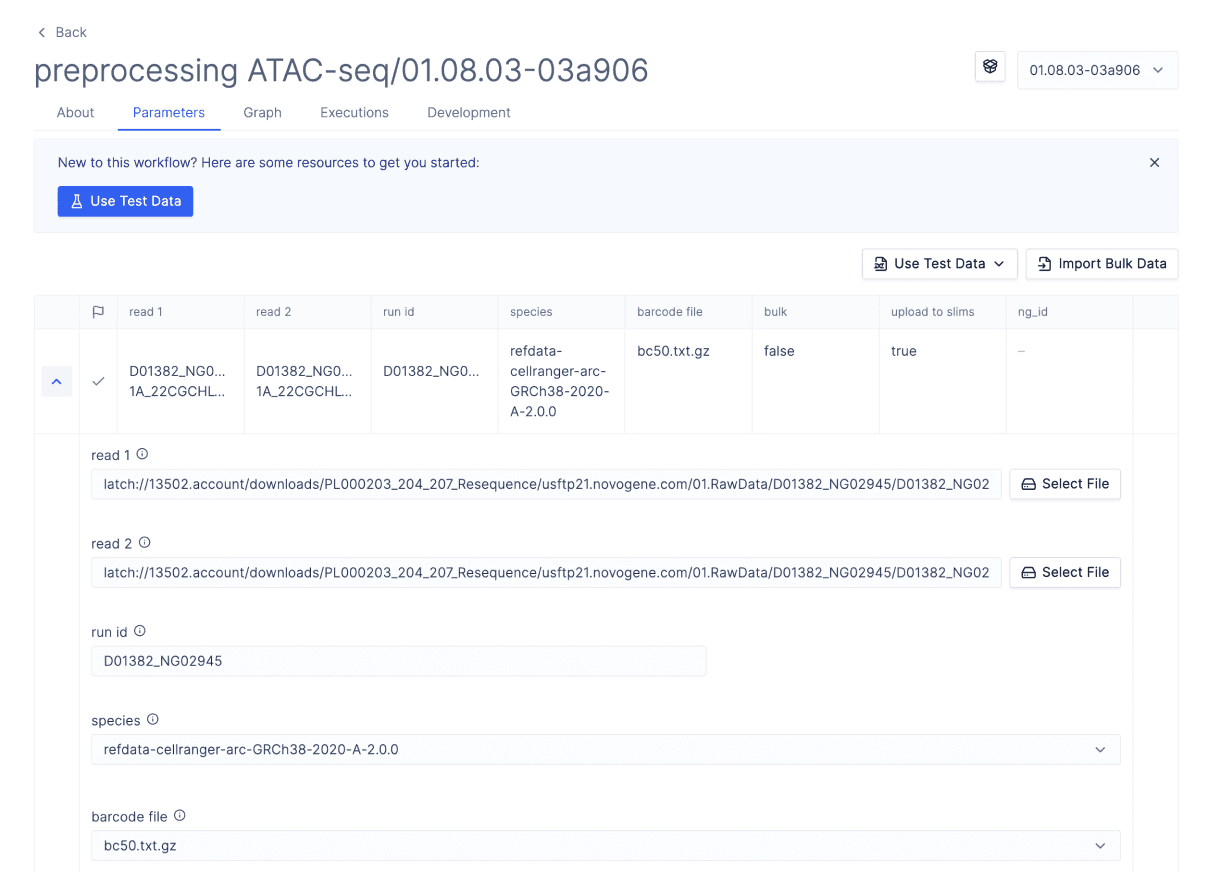
The bioinformatics workflow for pre-processing ATAC-seq data requires computers with large resource profiles, an environment with the proper dependencies setup, a system to move and track the large input and output files to and from the computer running this code. Additionally, the pipeline requires command-line expertise and was originally inaccessible to scientists, causing delays to AtlasXOmics’ clients.
Using the Latch SDK, AtlasXomics was able to create a user-friendly and scalable workflow that their scientists can independently run to generate fragment files from raw sequencing data generated from the DBiT-seq assay.
Finalizing Results for Delivery to Clients
After fragment files are generated, they are then packaged into an ArchR project using another workflow. Each package contains epigenetic fragment data paired with precomputed statistics necessary for downstream analyses.
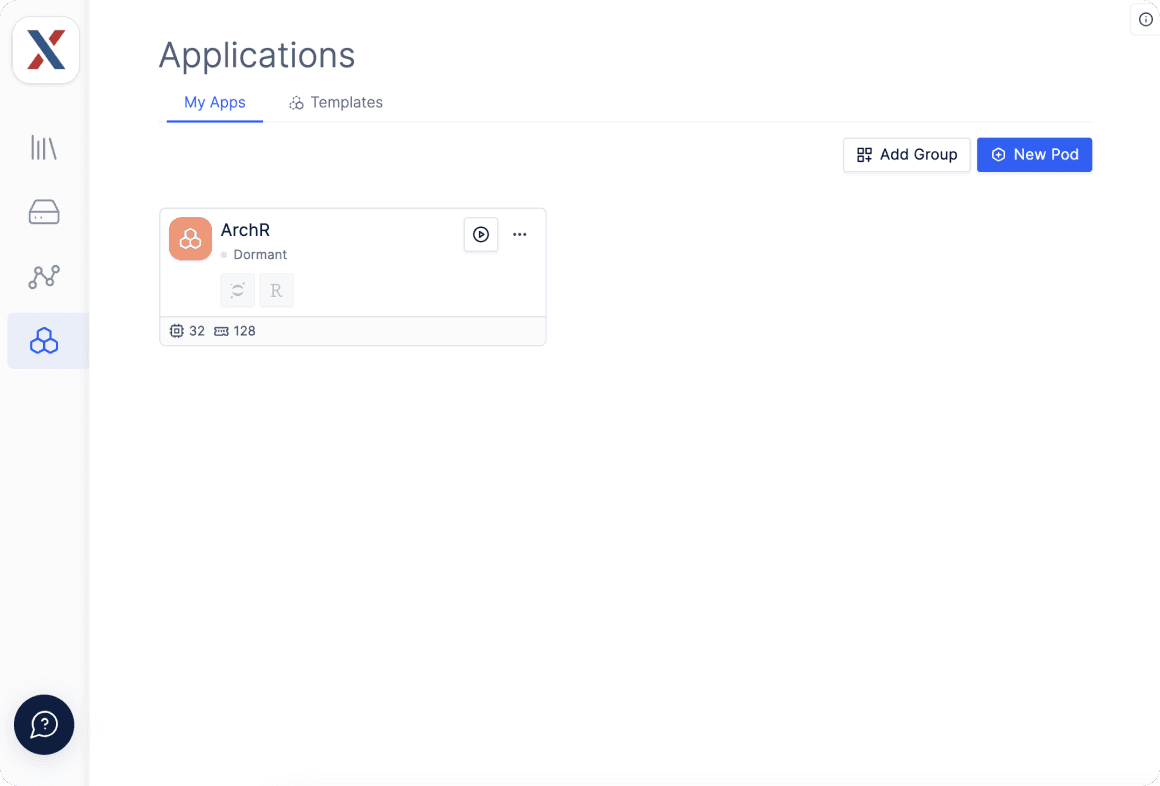
The resulting folder is directly pulled into Latch Pod setup with ArchR. A scientist can employ this method to identify distinct cell groups and understand their interactions using unbiased clustering. Additionally, they can detect gene regulatory elements associated with these groups through differential gene, peak, and motif analysis.
After finishing the analysis in ArchR, AtlasXomics uses Latch to handoff the resulting data and customized ArchR app to their customer. The customer can view all of the results in the platform, explore the ArchR app, and easily egress the data for further analysis in their environment.
Enabling biological discovery
Despite the potential of spatial ATAC-seq and CUT&Tag, widespread adoption of the assays has been limited by computational complexity of data analysis. However, AtlasXomics' microfluidics chip and DBiT-seq method, integrated with LatchBio cloud, democratize this technology for bench scientists, offering high-density, high-resolution molecular insights into tissue epigenetics.
This advance in the DBiT-seq technology is addressing a blind spot to most researchers by providing both spatial and epigenomic information directly from tissue samples. Epigenomic analysis via spatial ATAC-seq or CUT&Tag adds the much-needed spatial context missing from single-cell sequencing applications. Mapping the epigenome is an essential step in understanding regulation in gene expression underlying various disease states. The utilization of spatial epigenomics in translational research will be transformative to developmental biology, neuroscience, and oncology, among others.
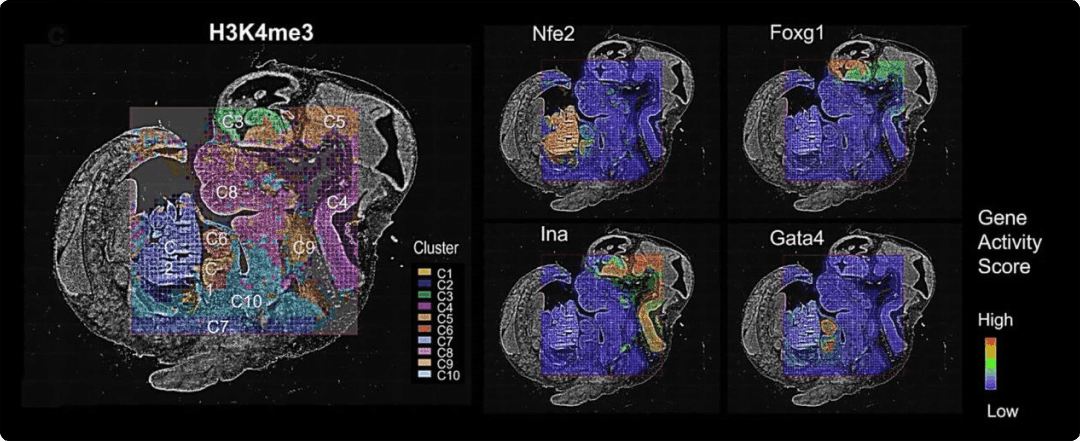
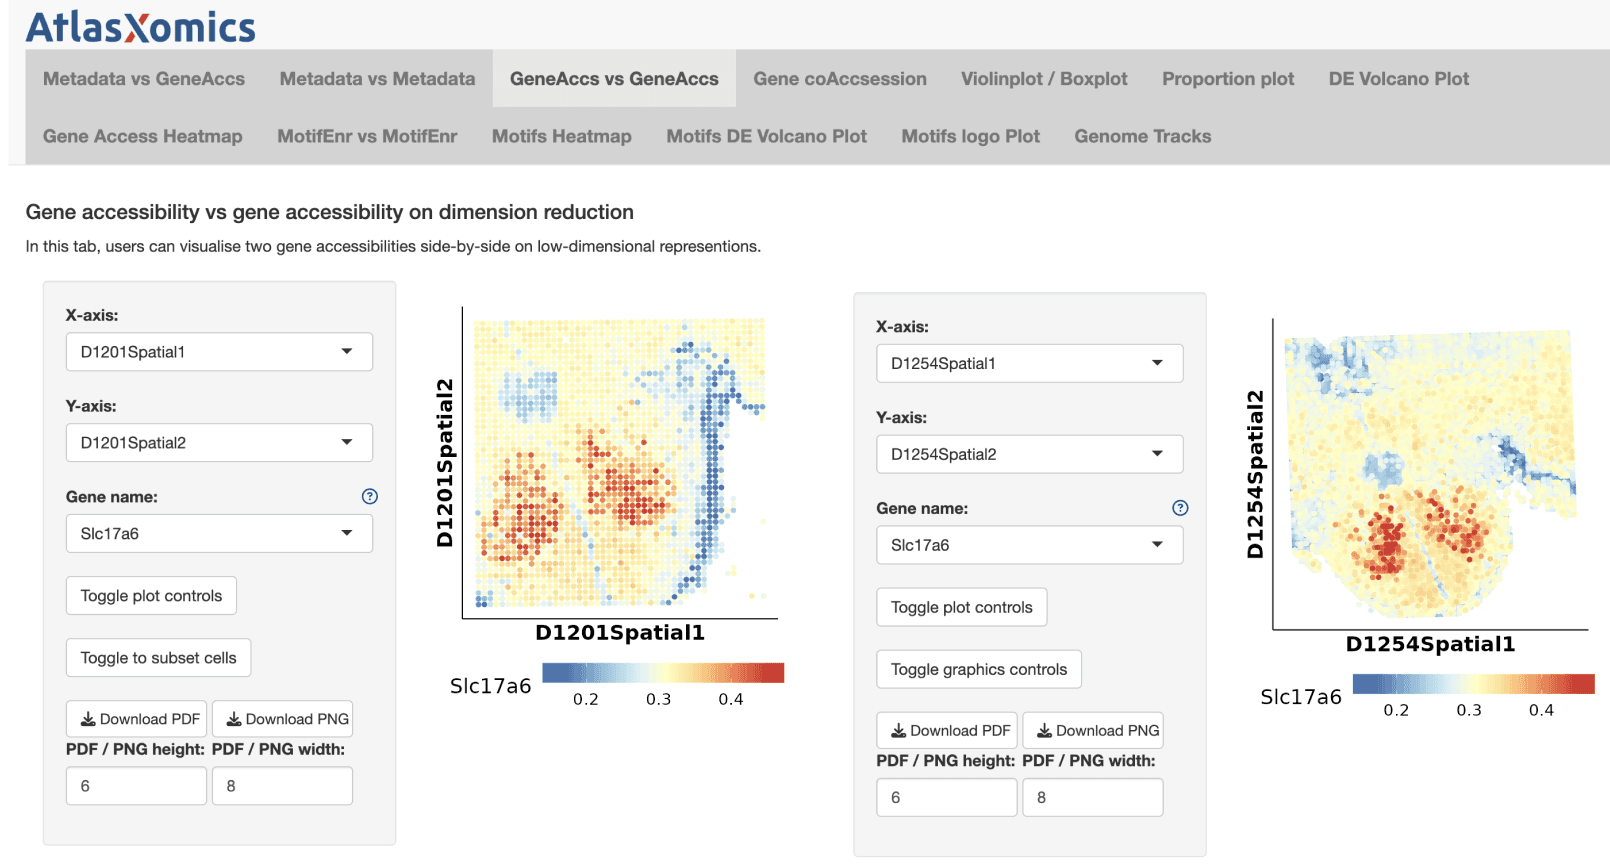
Map Genes of Interest
Similar to gene expression levels in a transcriptomic assay, ArchR uses gene activity scores that incorporate accessibility of both the gene body and distal regulatory elements are used to rank genes by epigenetic activity [3]. Combined with spatial information, these scores can be used to visualize the regulatory landscape of a gene of interest in the original tissue context.
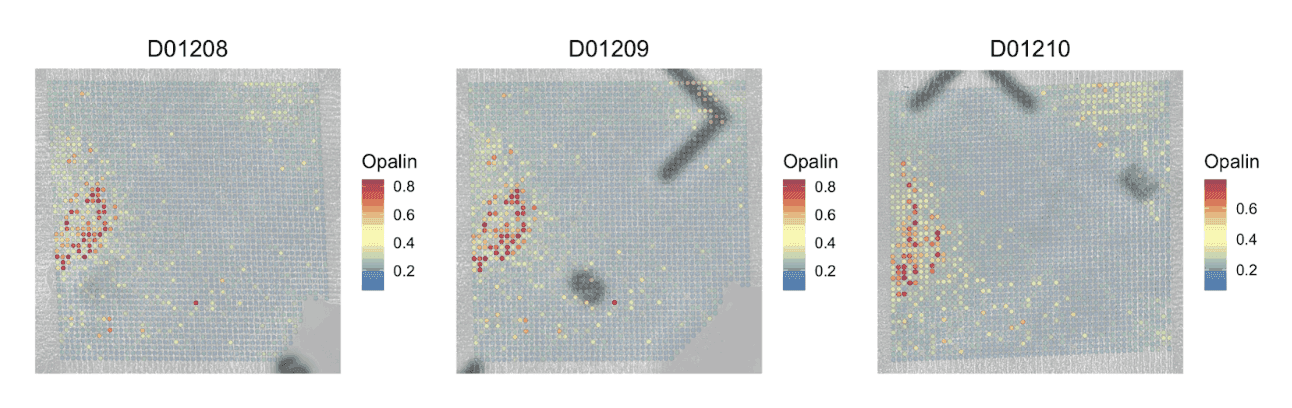
Pictured is a spatial heatmap of the gene activity score for Opalin, a marker gene for oligodendrocyte cells, across three spatial H3K27ac CUT&Tag replicates. H3K27ac is a histone modification associated with increased transcription and is recognized as an active enhancer mark.
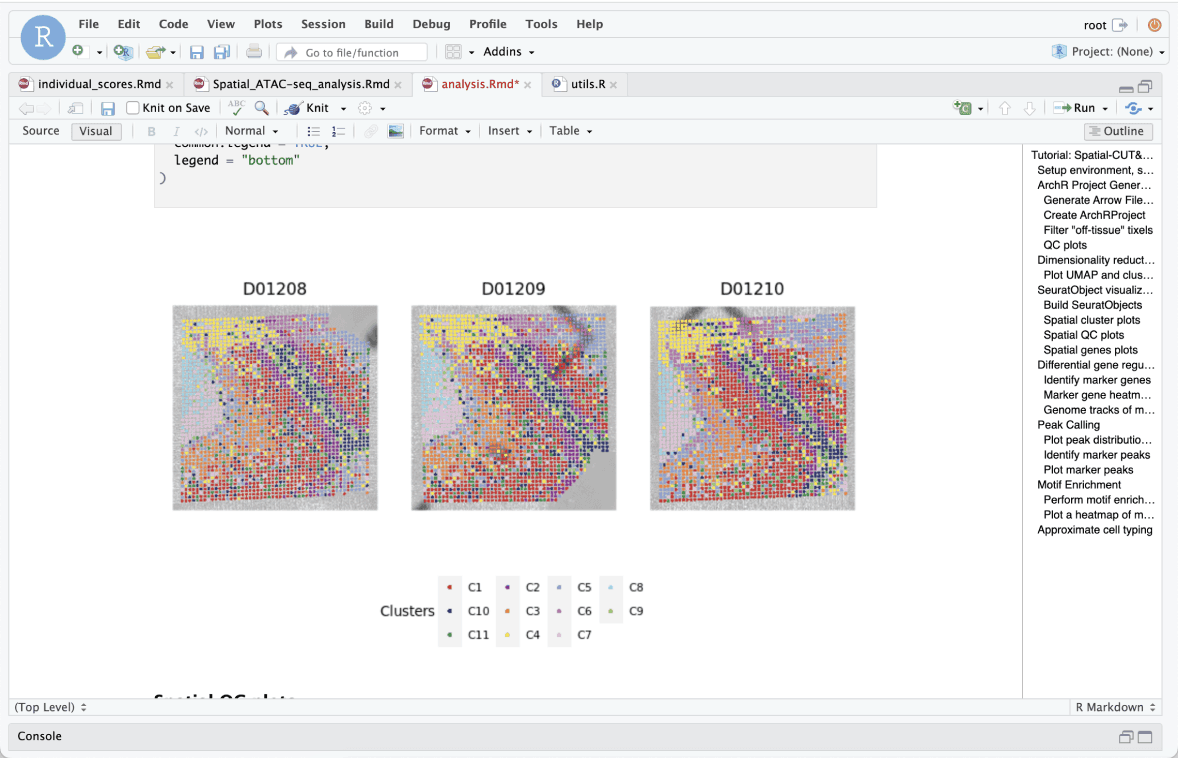
Cluster and Identify Cell Types Without Bias
The AtlasXomics analysis pipeline allows for unbiased clustering of cells and neighborhoods by similar epigenetic features. Cell types, along with their location in tissue, can then be identified by associating these groups with well-characterized marker gene(s). Spatial epigenomics can reveal discreet populations of cells and tissue heterogeneity purely through epigenetic signatures.
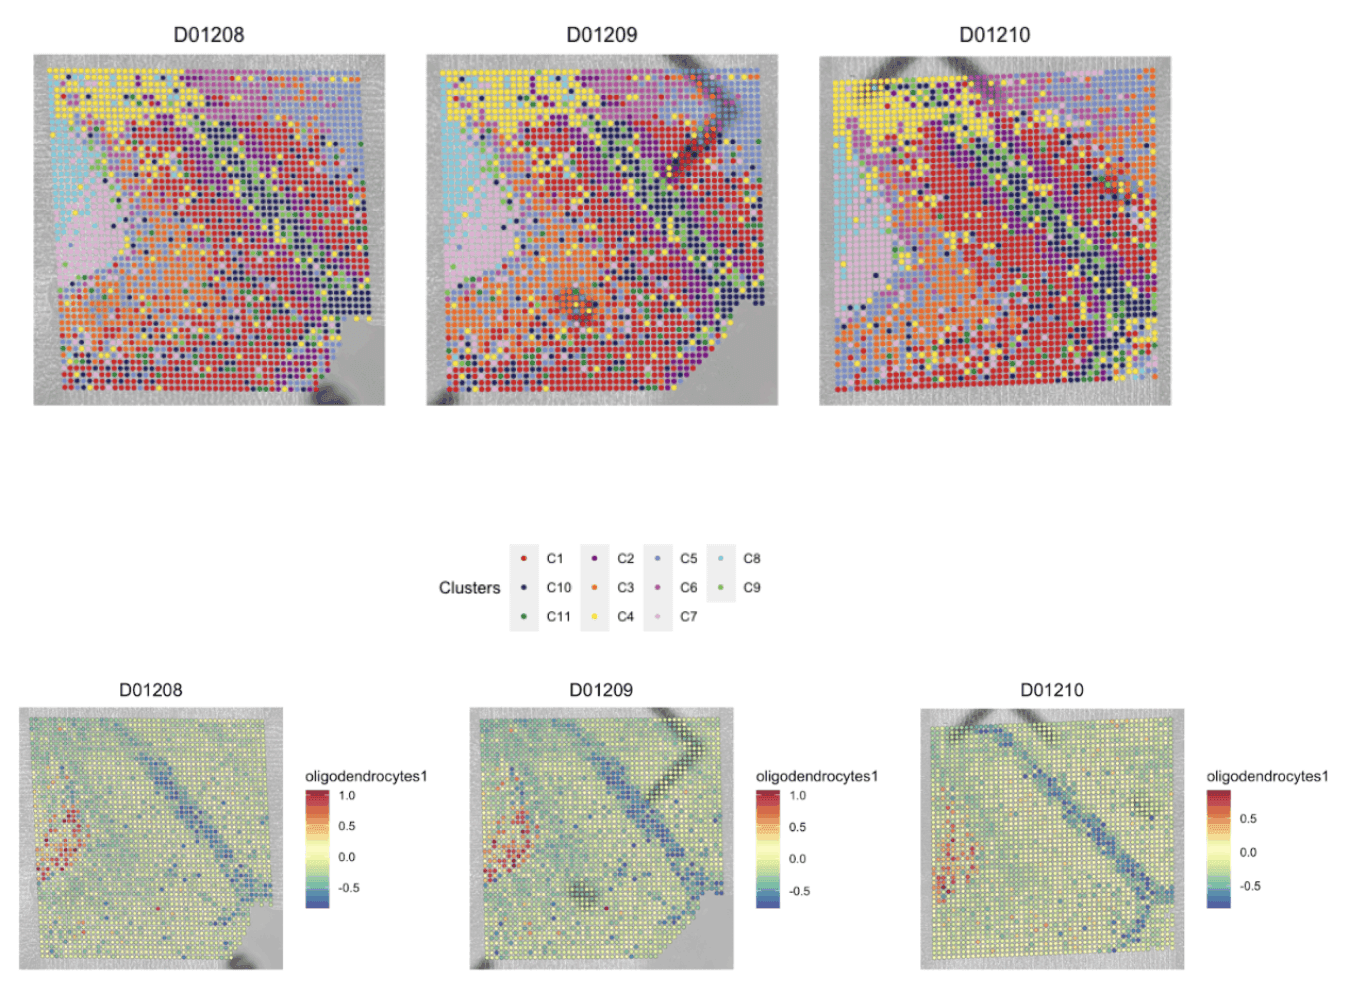
Top: Pictured is a spatial map of a mouse hippocampus showing the categorization of each tissue region into distinct Clusters, which loosely show the distribution of putative cell types across the tissue.
Bottom: Map of oligodendrocyte module score based on a combination of associated marker genes (Mbp, Opalin, Mog, Mobp, Cspg4, Cldn11)
Discover Differentially Activated Genes between Clusters
Identifying statistically significant gene activity between clusters of distinct epigenetic signatures can provide a new understanding of the biological mechanisms underlying tissue morphology.
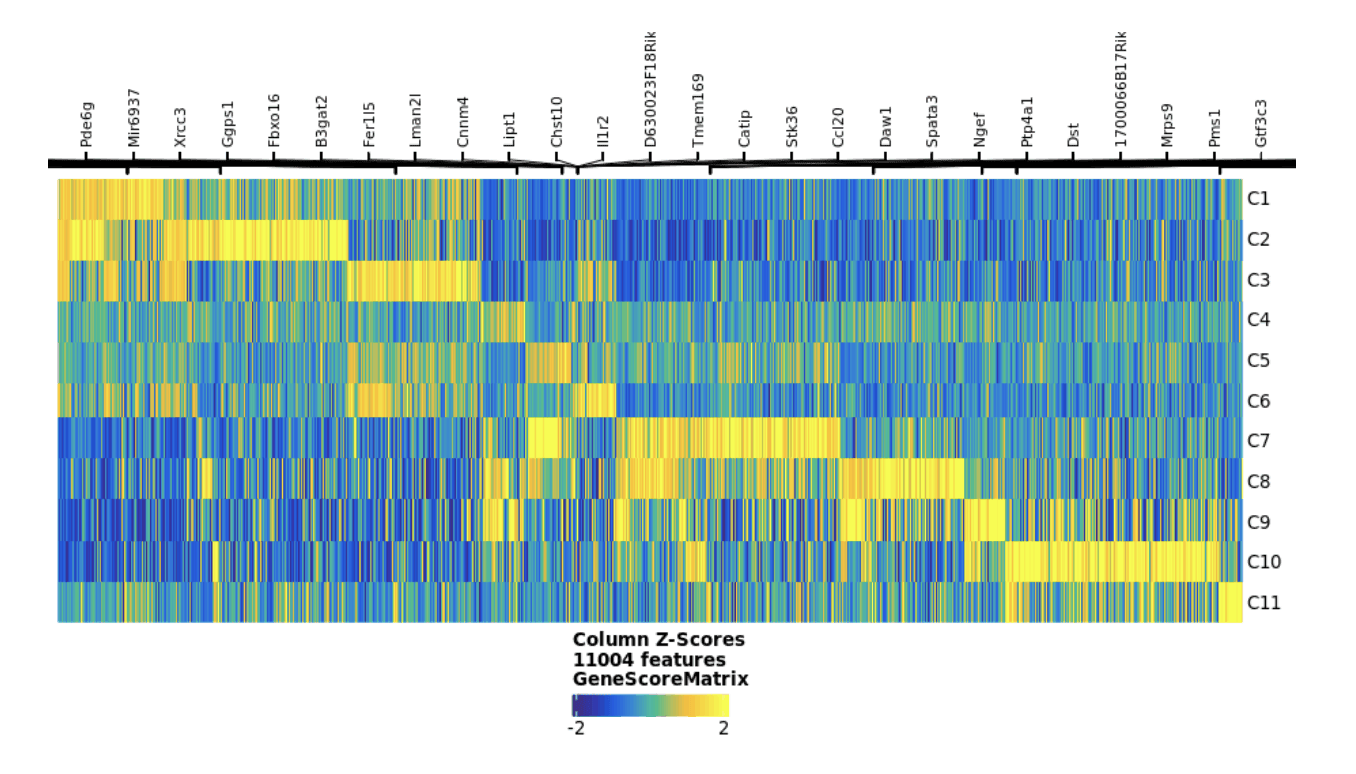
Pictured above is a clustered heat map of spatially differentiated gene activity scores from spatial CUT&Tag assay which are used to identify putative cell types.
Visualizing Chromatin Accessibility and Histone Modification Genome Tracks
The unbiased nature of spatial ATAC-seq and CUT&Tag allows for researchers to query the epigenetic signatures controlling expression for any gene. The custom app available through Latch helps to visualize local accessibility and histone modifications from pseudo-bulk data between clusters. Synthesis of accessibility and histone modifications around genes of interest can identify differential regulation of promoters, enhancers, and other regulatory elements in each distinct cell population.
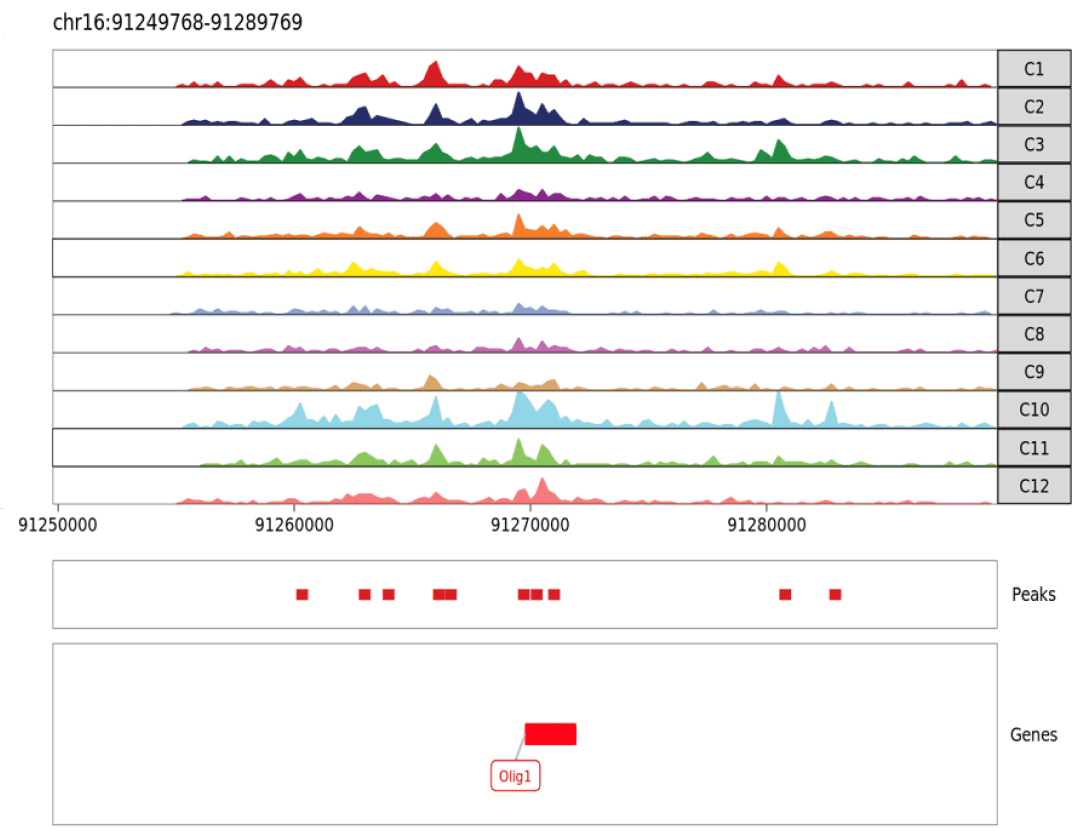
Pictured above is the genome browser track visualizing potential regulatory elements around Olig1 gene (a marker for oligodendrocytes). In spatial ATAC-seq, peaks represent open chromatin. In spatial CUT&Tag, peaks represent genome regions with a specific histone modification.
Differential Regulatory Landscape by Cell Clusters
Researchers can identify unique cell epigenetic signatures by clustering and distribution of accessible regulatory elements. This allows for the analysis of widespread changes to the chromatin that impact gene regulation based on a cell cluster’s local environment.
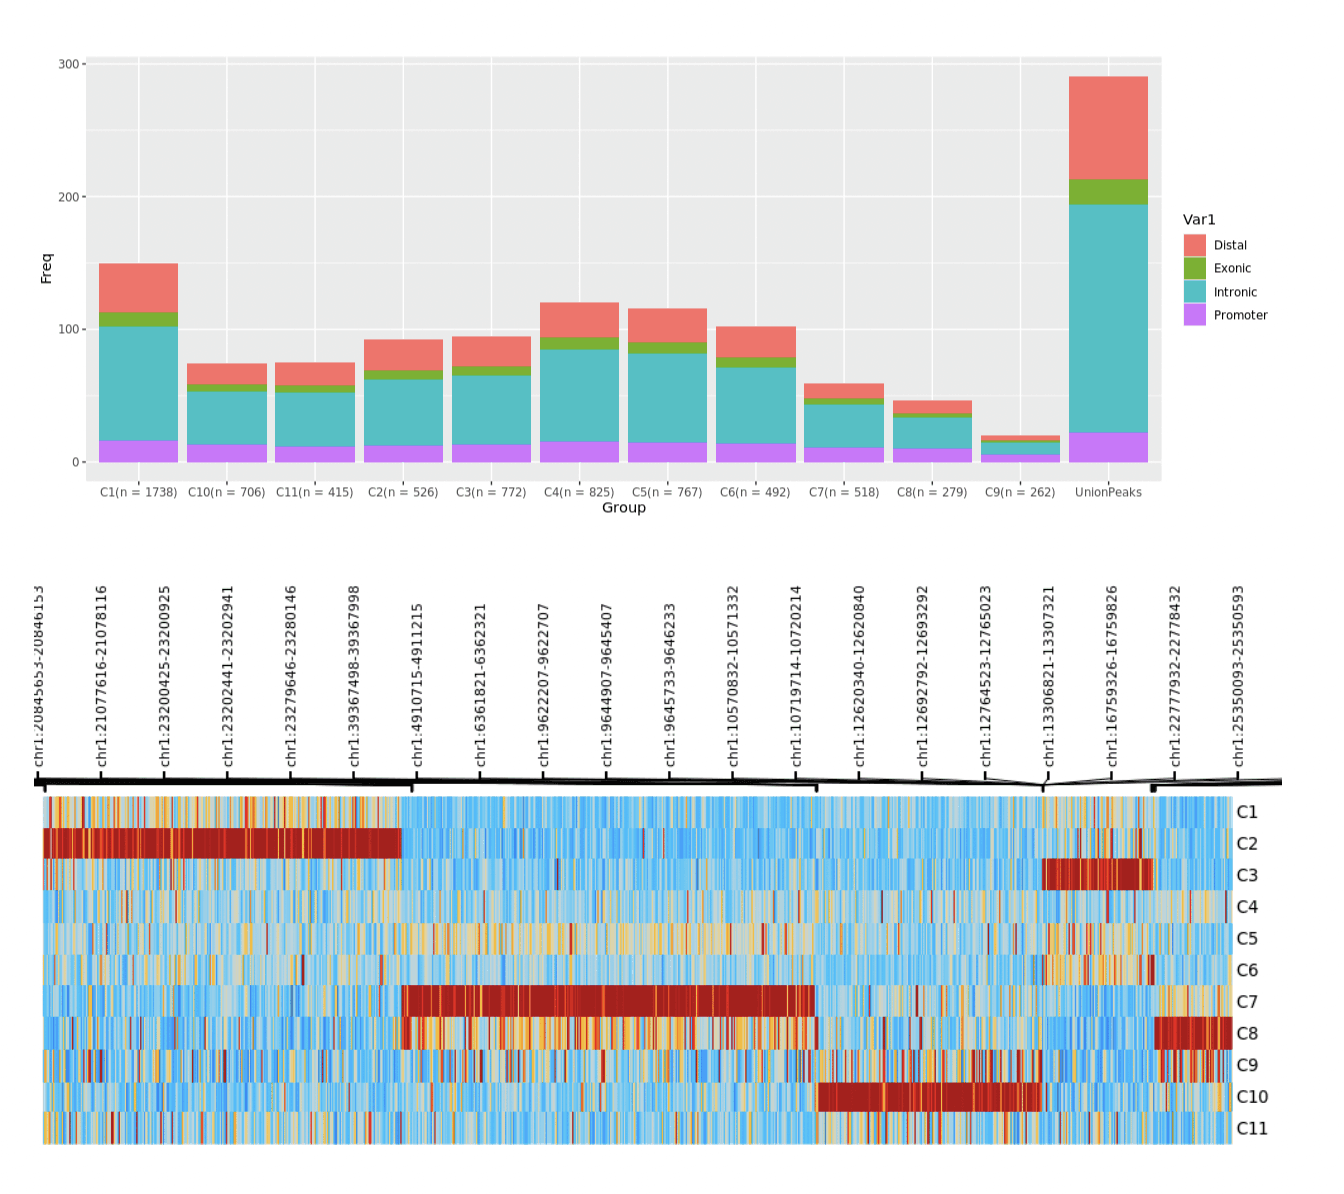
Top: Pictured above shows the distribution of regulatory elements by distal, promoter, intronic and exonic regions in each cluster.
Bottom: differential regulatory elements associated with each cluster.
Empowering Spatial Epigenomic Analysis
By integrating the revolutionary technology of DBiT-seq and the Latch environment, AtlasXomics and Latch are democratizing spatial epigenomics. All biologists can now access genome-wide spatial epigenomics insights and push the boundaries for omics analyses in their respective fields.
Sources
- Vandereyken, K., Sifrim, A., Thienpont, B. et al. Methods and applications for single-cell and spatial multi-omics. Nat Rev Genet 24, 494–515 (2023). https://doi.org/10.1038/s41576-023-00580-2
- Yanxiang Deng et al.,Spatial-CUT&Tag: Spatially resolved chromatin modification profiling at the cellular level.Science375,681-686(2022).DOI:10.1126/science.abg7216
- Granja, J.M., Corces, M.R., Pierce, S.E. et al. ArchR is a scalable software package for integrative single-cell chromatin accessibility analysis. Nat Genet 53, 403–411 (2021). https://doi.org/10.1038/s41588-021-00790-6
- Buenrostro JD, Wu B, Chang HY, Greenleaf WJ. ATAC-seq: A Method for Assaying Chromatin Accessibility Genome-Wide. Curr Protoc Mol Biol. 2015 Jan 5;109:21.29.1-21.29.9. doi: 10.1002/0471142727.mb2129s109. PMID: 25559105; PMCID: PMC4374986.
- Zhang, H., Song, L., Wang, X., Cheng, H., Wang, C., Meyer, C. A., ... & Li, H. (2021). Fast alignment and preprocessing of chromatin profiles with Chromap. Nature communications, 12(1), 1-6. https://doi.org/10.1038/s41467-021-26865-w
- Deng, Y., Bartosovic, M., Kukanja, P., Zhang, D., Liu, Y., Su, G., Enninful, A., Bai, Z., Castelo-Branco, G., and Fan, R. (2022). Spatial-CUT&Tag: Spatially resolved chromatin modification profiling at the cellular level. Science 375, 681-686. 10.1126/science.abg7216.
- Bale, T.L. (2015). Epigenetic and transgenerational reprogramming of brain development. Nature Reviews Neuroscience 16, 332-344. 10.1038/nrn3818.
- Zheng, Y., Habes, M., Gonzales, M., Pomponio, R., Nasrallah, I., Khan, S., Vaughan, D.E., Davatzikos, C., Seshadri, S., Launer, L., et al. (2022). Mid-life epigenetic age, neuroimaging brain age, and cognitive function: coronary artery risk development in young adults (CARDIA) study. Aging (Albany NY) 14, 1691-1712. 10.18632/aging.203918.
- Lu, Y., Chan, Y.-T., Tan, H.-Y., Li, S., Wang, N., and Feng, Y. (2020). Epigenetic regulation in human cancer: the potential role of epi-drug in cancer therapy. Molecular Cancer 19, 79. 10.1186/s12943-020-01197-3.
- Yang, J.-H., Hayano, M., Griffin, P.T., Amorim, J.A., Bonkowski, M.S., Apostolides, J.K., Salfati, E.L., Blanchette, M., Munding, E.M., Bhakta, M., et al. (2023). Loss of epigenetic information as a cause of mammalian aging. Cell 186, 305-326.e327. https://doi.org/10.1016/j.cell.2022.12.027.